
If you want to analyze and improve the performance of your website, I can definitely recommend you the following tool.
Website Performance Test WebPageTest.org
It can also help you to detect the root cause if you’re webpage is loading very slow.
You can run the performance test from different locations in Europe, America or Asia and specify the maximum network speed like 4G. Of course there are also advanced options like disabling JavaScript, ignoring SSL Certificate Errors and so on, but you can directly check it out before running your test!
An important note is that it can also be used with an HTTP Basic Authentication because you are able to pass the userdata there. This is very useful for development environments in subdirectories or subdomains.
Web Page Performance Test for hackbuddies.com
This week I tested my website to get an overview of the performance and I wanted to share the results with you so you can also get a quick overview of the tool and possibilites. In this test I did not define any advanced options, just the location Frankfurt in Europe as a location. Let’s check the results: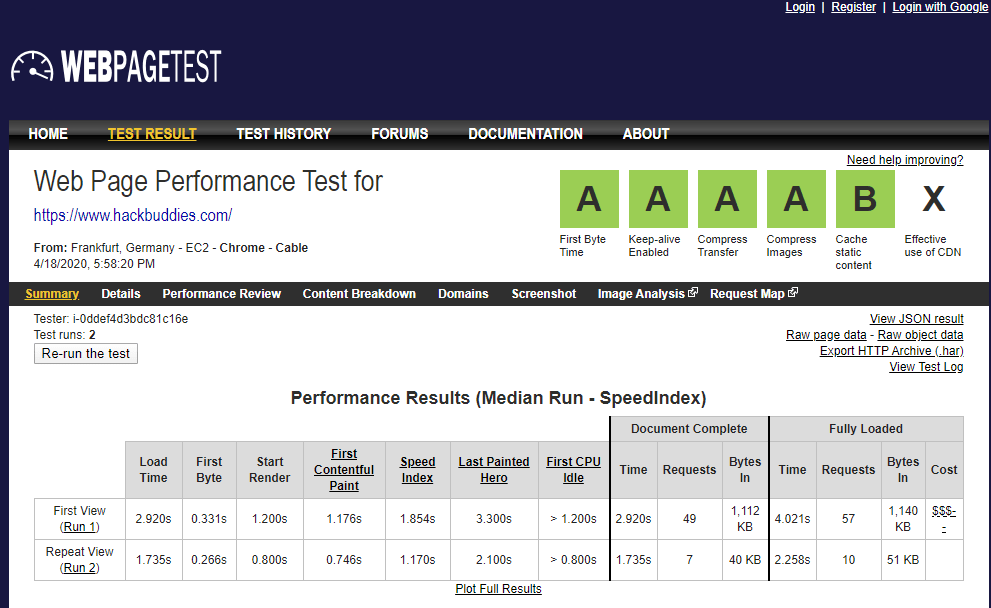 So, on the top you will get a first overview with the grades. The main categories here are:
- Time to First Byte (TTFB)
This is basically the server response time (back-end side) - Keep-Alive Enabled
HTTP persistent connections are about sending concurrent requests over a single connection - Compress Transfer
gzip compression can be used for HTTP requests and is able to reduce the size of the HTTP responses - Compress Images
Checks images which can be compressed without losing image quality - Cache Static Content
Caching details are transferred in the header of the response from the server. With the help of cached static content you can save resources and requests. - Effective Use of CDN (Content Delivery Network)
A CDN is a distributed network of proxies (data centers) and offers high availablity as well as performance for globally distributed end users
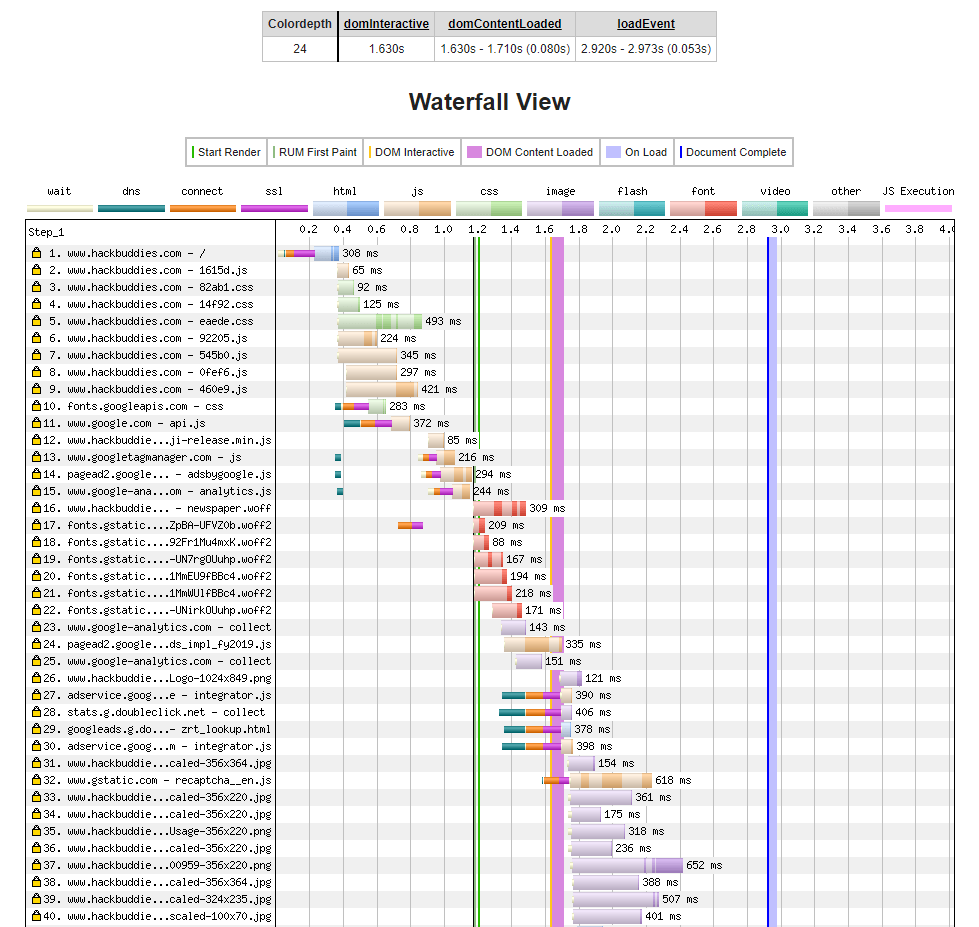
Waterfall View/Diagram
In the Waterfall View you can easily determine loaded files which take a lot of time and are therefore slowing down your page speed significantly. You will find images, CSS and JS files as well as fonts (e.g. in format .woff2). Of course these files can also be loaded from external sources like Google Fonts.
In the diagram you can differentiate between waiting times, DNS resolution, connection, SSL encryption and so on:
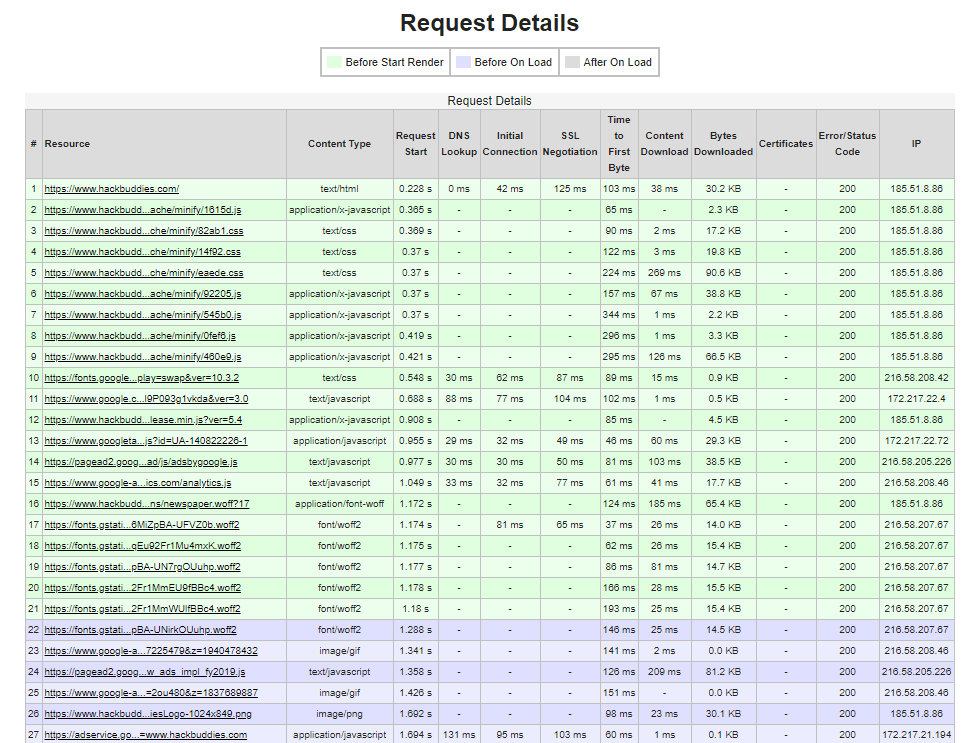
Request Details
You can get an even more detailed overview by navigating to the Request Details by simply scrolling down a bit at the Waterfall Diagram. You will see the start time of the request, the time for the DNS lookup, the Time To First Byte (interesting for external sites), the HTTP status codes and much more:
Performance Review
Last but not least I want to tell you a little bit about the Performance Review. Here are all files listed and you will see all grade evaluations for each file which is really really useful. As you can see in the screenshot, I haven’t configured a Content Delivery Network (CDN) yet for my website and therefore it is just available at external sources like Google Analytics or Fonts. But I am currently setting up CloudFlare and will write an article about it if you are interested.
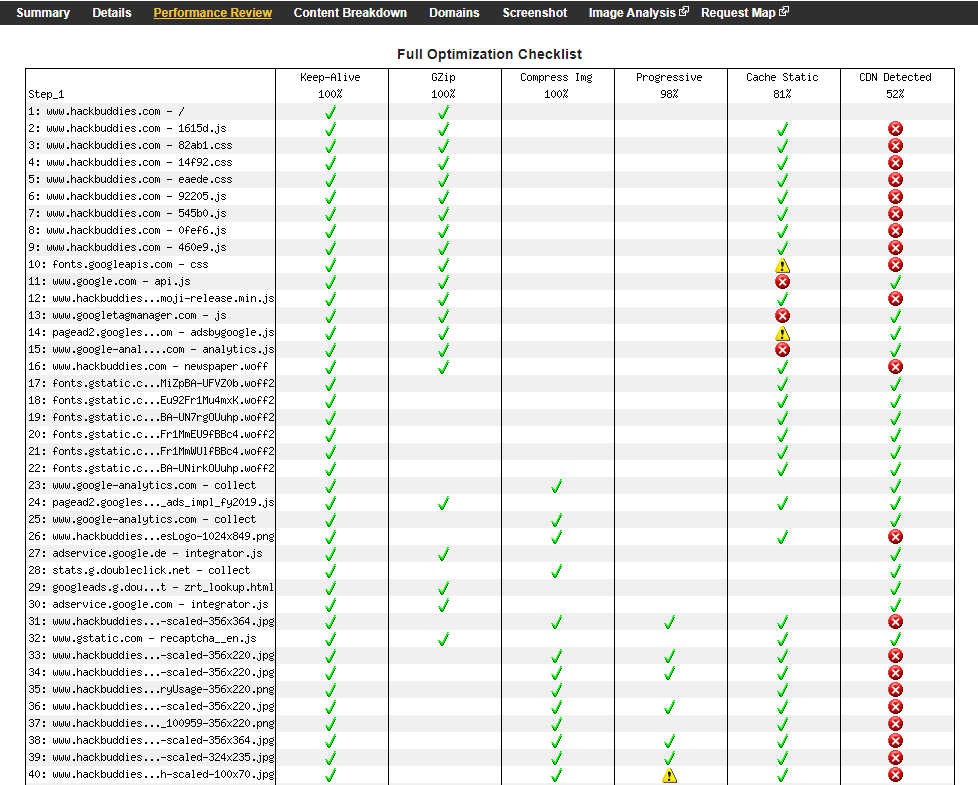
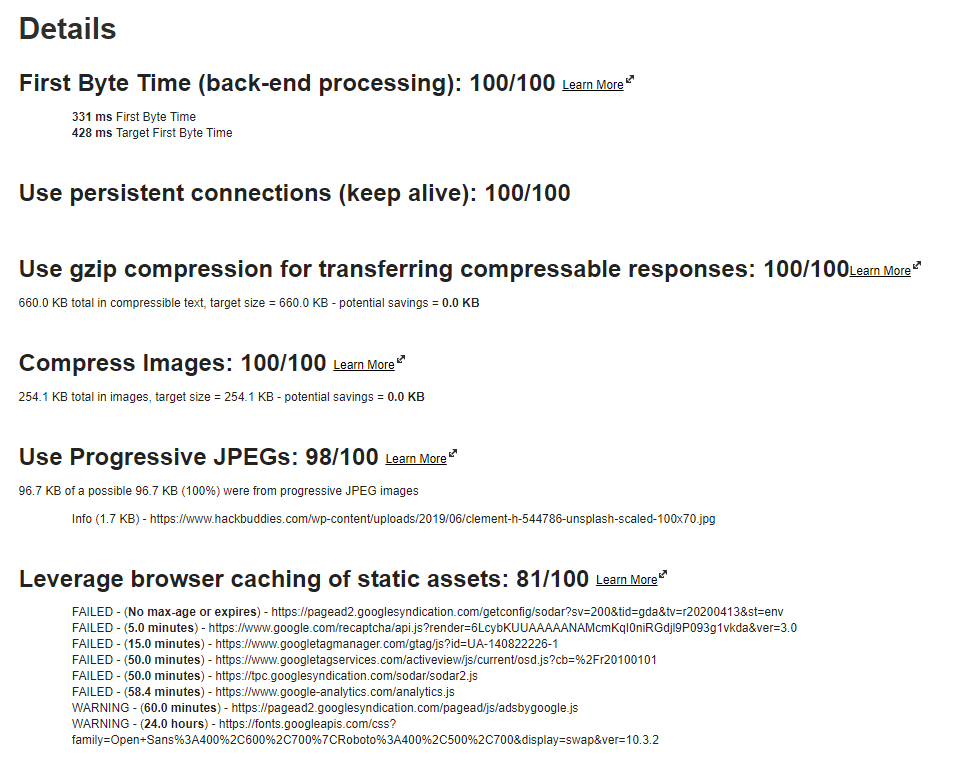
Performance Details
After scrolling down you will get a summary for the assessment of your grades. You can easily detect non-progressive JPEGS, non-compressed images or non-cached content. In this way you are able to easily determine and fix these things which will improve your website speed – believe me 🙂
Maybe you are now also interested in executing a Website Performance Test WebPageTest.org and want to share your results here.
 Disassembly")


 Disassembly")


 for your WordPress Website")